Smart Money is a weekly overview of everything finance. We provide the best actionable information and insights on Forex, Stocks, and Crypto Currencies. Smart Money is intended for Investment Awareness and Education and should not be considered Financial Advice.
Welcome to Smart Money’s third edition! In the investment realm, Smart Money refers to the capital under the control of institutional investors, central banks, and other financial titans. Simply put, it’s the money wielded by the experts in the financial world.
“Smart money knows how to preserve as well as grow wealth.” – Robert Kiyosaki
In this edition, we will go through
- Overview of Macro-Finance
- Status of Forex Market
- Status of Stock Market
- Status of Crypto Market
- Bitcoin, Ethereum, and Opportunities
Overview of Macro-Finance
Table of Contents
Top economists predict a year of slow global growth and uncertainty due to geopolitical tensions, tight finances, and the impact of artificial intelligence.
- Most anticipate weaker global economic conditions in 2024, with China and the U.S. likely to experience moderate or strong growth, while Europe faces weak prospects.
- South Asia and East Asia-Pacific show a more positive outlook.
Meanwhile, the International Monetary Fund forecasts a slight drop in global economic growth to 2.9% in 2024 from last year’s 3%. On the other hand, the World Bank warns of the weakest global growth since the 1990s, with one in four developing economies experiencing increased poverty post-pandemic.
Besides, amid heightened geopolitical tensions, including the Russia-Ukraine conflict and China-U.S. relations, 2024 will witness elections in over 75 countries, including major economies like the U.S. and U.K.
US
In the 1970s, Fed Chair Arthur Burns shifted policy too early, leading to a resurgence of inflation. His successor, Paul Volcker, had to take extreme measures to regain control. A similar scenario could unfold on a smaller scale this year.
- One risk is a supply shock, especially if a Middle East conflict raises oil prices and disrupts shipping.
- The other threat comes from relaxed financial conditions, as the five-year Treasury yield has dropped over a percentage point since October.
If we factor in a 1% point drop in yields for the US economy in 2024, it could push inflation up by half a percentage point, bringing it closer to 3% rather than the 2% target. In such a case, the Fed might need to pause its policy pivot, contradicting market expectations of a more lenient stance.
Europe
While the US faces the risk of an overheated economy, Europe is on the opposite end of the spectrum. The European Central Bank and Bank of England are concluding their most aggressive tightening cycles in decades, and running their hikes through any macroeconomic model predicts a clear outcome: a significant recession.
Bloomberg projects a potential 2.5% hit on Euro-area gross domestic product and a 4.7% impact on the UK.
- Given the challenges of forecasting during the pandemic and the Ukraine war, the models may be incorrect.
- However, another possibility exists: the effects of monetary policy may take time to materialize.
- In Europe, a significant impact might still be on the horizon.
Meanwhile, Germany, the economic powerhouse of Europe and the fourth-largest globally, shrank last year, continuing a six-year slump.
- Various challenges fuel this extended downturn, including slower growth in China, higher energy prices and interest rates, global trade tensions, and the complex shift to green energy.
With no immediate signs of improvement in these cyclical and structural factors, Germany’s prospects appear grim.
China
Speaking in Davos, Switzerland, Chinese Premier Li Qiang revealed that China’s economy surpassed the 2023 official growth target of 5.2% without resorting to “massive stimulus.”
- Initially considered conservative, the 2023 growth goal faced challenges from persistent deflationary pressures and a prolonged property slump.
However, economists remain cautious. While China’s economy expanded by 5% in 2023, it’s a modest increase from the Covid-affected 2022.
- Estimates suggest the country would have fared 2% worse in a more regular 2022.
The focus now shifts to how Beijing sustains momentum amidst eroding confidence. China is contemplating a 1 trillion yuan ($139 billion) debt issuance under a special sovereign bond plan to bolster the economy.
- Concerns grow as foreign investment turned negative in the third quarter of 2023, reflecting reduced reinvestment in China by firms.
- Besides, China’s debt has reached an all-time high at 280% of its economy.
Anyhow, meeting the 2023 GDP target was achieved, but maintaining the same pace in 2024 poses challenges.
- While optimistic investors allocated funds to China in 2023, they have withdrawn most.
- However, Wall Street seems patient, with JPMorgan forecasting an 18% rise in the MSCI China index by December and Goldman Sachs’ targets aligning.
So, consider this downturn as a January sale if you see potential in robust sectors like automation, robotics, and green technology.
Status of Forex Market
DXY
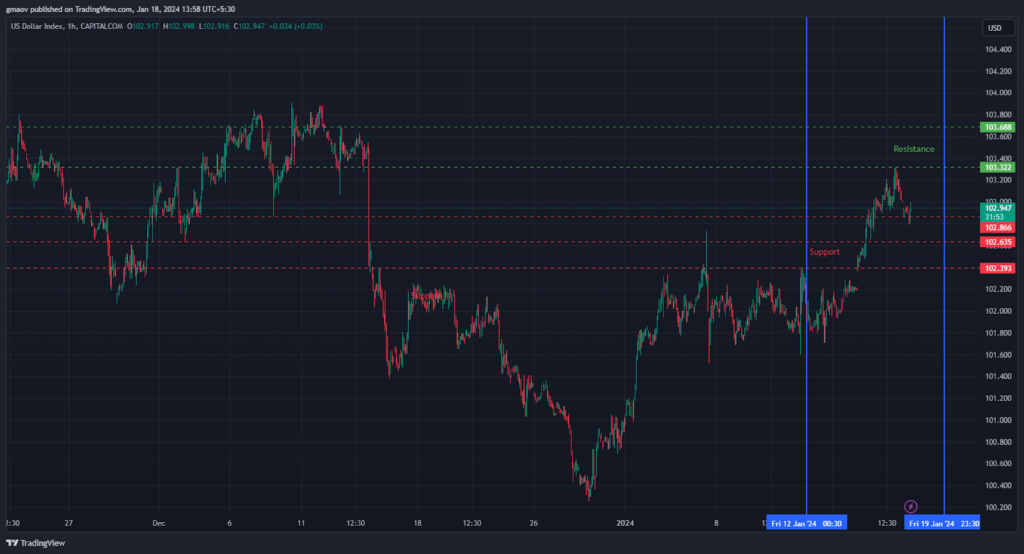
After robust gains on Wednesday, the dollar slightly retreats as investors scale back expectations for interest-rate cuts.
- Improved U.S. retail sales and industrial production data contribute to this shift, albeit moderately.
- Moreover, the prevailing market risk-off sentiment and rising yields temporarily support the dollar.
Despite this, the market still factors in around 150 basis points of cuts by year-end. Fed officials, including Governor Christopher Waller, are pushing back against expectations of swift policy loosening.
In the short-term forecast for the U.S. Dollar Index, bullish sentiment prevails, driven by the Fed’s hawkish stance and robust U.S. retail sales data.
Euro
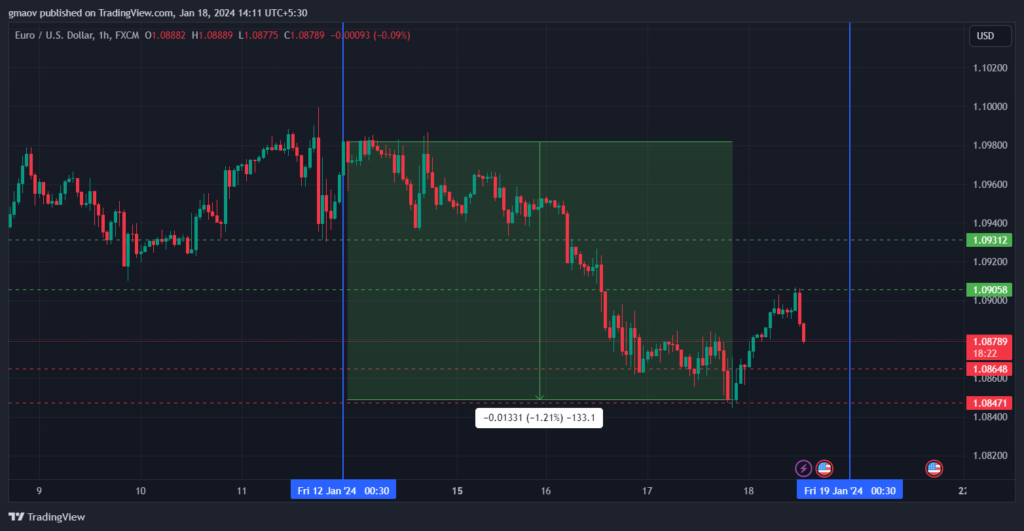
On Wednesday, the Euro rebounded from a five-week low of $1.0845, bolstered by ECB President Christine Lagarde’s remarks.
- Lagarde suggested that there would probably be majority support among ECB officials for an interest rate cut in the summer, deviating from market expectations of a spring cut.
- However, on Thursday, the Euro faced downward pressure against the US Dollar as unexpectedly strong US Retail Sales prompted a return of safety flows to the USD.
Currently, EUR/USD buyers are holding their ground, but sellers remain ready to attempt further downside momentum.
Interest Rates

Since June 2023, interest rates have demonstrated remarkable stability, resembling the steady trend seen during the bullish years of 2020-2022, as highlighted in the last Smart Money edition.
- The US Federal Reserve recently opted to maintain interest rates at a 22-year high, indicating the possibility of up to three interest rate cuts this year.
- This decision is due to progress in addressing inflation concerns.
Moreover, according to the Fed’s regular update on economic conditions, known as the “beige book,” businesses in recent weeks have expressed optimism about the likelihood of lower rates in the upcoming months.
While inflation is well below last summer’s peak of over 9%, it remains more than a percentage point higher than the Fed’s target rate of 2%. Many market observers anticipate interest rate cuts as early as the Fed meeting in March.
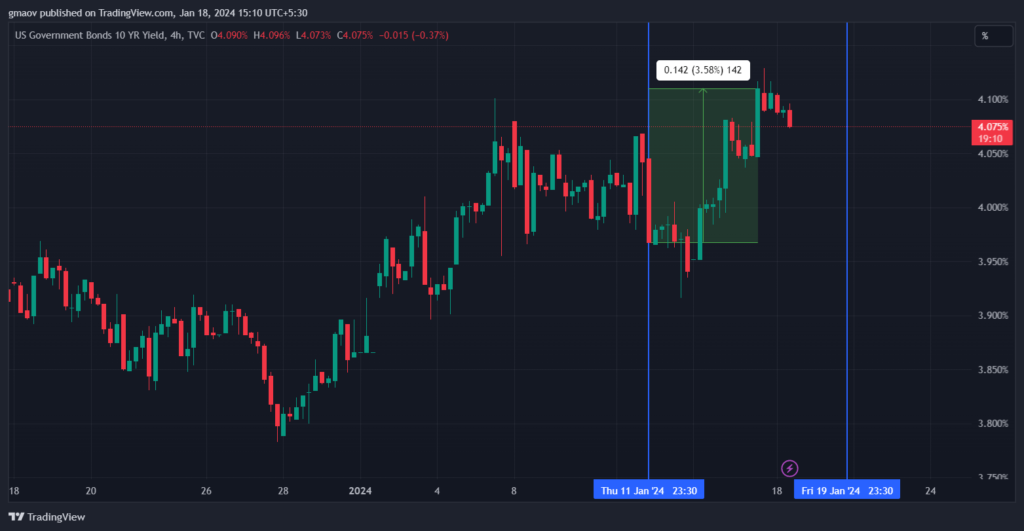
Meanwhile, Treasury yields rose following the release of robust U.S. economic data. The 10-year Treasury yield reached around 4.129%, continuing its ascent from Tuesday.
- This upward movement was driven by the focus on stronger-than-expected December retail sales and comments from Federal Reserve Governor Christopher Waller cautioning that monetary policy easing might occur more gradually than expected.
- However, it has since retreated to 4.075%.
The year 2023 proved tumultuous for bond markets, witnessing the 10-year Treasury yield surpass 5% in October before closing the year below 3.9%.
- Factors like interest rate hikes, persistent inflation, recession concerns, and market shocks like the U.S. regional banking crisis shaped the bond markets in 2023.
Many of these factors are likely to continue exerting a significant influence in the year ahead.
Status of the Stock Market
Stocks exhibit a mixed performance as policymakers resist prevailing expectations of early and frequent interest rate cuts by central banks in 2024.
- European stocks rebounded on Thursday, recovering from lowered expectations of imminent interest rate cuts by major central banks.
- The previous day saw European and U.S. stocks dip due to higher-than-anticipated UK inflation and U.S. retail sales data, coupled with hawkish comments from European Central Bank officials.
Additionally, weaker-than-expected gross domestic product figures from China impacted market sentiment.
- The sluggish recovery in China last year is particularly concerning for companies relying on the world’s second-largest economy.
Meanwhile, U.S. stock futures experienced a slight rise on Thursday, with S&P 500 futures up by 0.4% and Nasdaq-100 futures advancing 0.7%. Dow Jones Industrial Average futures remained relatively flat as the market attempted to regain its footing following a recent losing session.
- On Wednesday, the Dow had fallen 94 points (0.25% to 37,267), the S&P 500 declined 27 points (0.56% to 4,739), and the Nasdaq Composite dropped 89 points (0.59% to 14,856).

The S&P 500 experienced a turbulent beginning to the year, stepping back from near-record highs as investors tempered expectations of imminent interest rate cuts.
- Just seven companies known as the Magnificent Seven- Amazon, Apple, Tesla, Alphabet, Microsoft, Nvidia, and Meta- drove the remarkable 24% rally in the S&P 500 in 2023.
- These companies effortlessly contributed to upticks ranging from 50% to 240%, making them highly lucrative investments.
- However, this success came with a caveat — these stocks now carry more expensive valuations.
The Magnificent Seven currently boast an average forward price-to-earnings ratio of 44 times, surpassing double the S&P 500’s average. Essentially, this makes them among the most expensive stocks available. Simply put, it might be an opportune time to reinvest in the market.
Stock Market & Election Years

Source: Hulbert Ratings
A typical stock market trend in a presidential election involves weakness in the first half and strength in the second half. The chart illustrates the Dow Jones Industrial Average’s trajectory in the average presidential election year compared to its path in the other three years of the presidential cycle.
- By the midpoint of presidential election years, the Dow’s average year-to-date performance is a decline of 0.7%, five percentage points below its average first-half gain of 4.3% in non-election years.
However, the second half of presidential election years tell a different story, with the stock market exhibiting greater strength than non-election years.
- The Dow’s average second-half return in presidential election years is 8.6%, compared to 3.0% in all other years.
Ultimately, the net full-year result shows minimal performance difference between election and non-election years.
- This historical pattern suggests a potential for a weak stock market in the coming months.
As of mid-January, the Dow Industrials have incurred a loss of over 1%, deviating from the average full-month gain of 0.9% for all Januarys since the Dow’s inception in the 1890s.
Anticipating weakness in the year’s first half doesn’t necessarily mean adopting a bearish stance on the stock market’s overall trend. However, it’s essential to recognize that trees don’t grow to the skies, and prices don’t ascend in a straight line.
Oil

On Thursday, oil prices climbed as OPEC anticipated significant growth in global oil demand in the next two years, alongside disruptions in U.S. oil production due to a cold blast and tensions in the Middle East.
- Brent crude futures rose by 0.6% to $78.37 a barrel, and U.S. West Texas Intermediate crude futures increased by 1.0% to $73.26.
According to OPEC’s monthly report, world oil demand will likely increase by 1.85 million barrels per day (bpd) in 2025, reaching 106.21 million bpd.
- OPEC’s forecast for 2024 shows demand growth of 2.25 million bpd, consistent with the December forecast.
However, an unexpected surge in U.S. crude stockpiles and challenges in China’s economic recovery dampened the outlook for oil demand.
Crypto Currencies

Crypto is currently facing challenges from a three-pronged issue.
- Celsius Sell Pressure:
- Celsius, a crypto lender that faced bankruptcy in 2022, is undergoing a rebalancing of assets by the bankruptcy estate.
- This process, including unstaking ~$1.6 billion in ETH holdings, has triggered concerns of a significant sell-off.
- Investors closely monitor Celsius wallets as the unstaking process unfolds.
- Fortunately, the staking queue spans around 14 days, mitigating the risk of a sudden mass sell-off.
- GBTC Sell Pressure:
- The Grayscale Bitcoin Trust (GBTC), one of the world’s largest Bitcoin holders, recently changed significantly.
- On January 11, it successfully transformed into a spot Bitcoin ETF, allowing investors to redeem their shares.
- Consequently, this transformation has led to the sale of hundreds of millions of dollars worth of BTC.
- Many believe that this ongoing sell pressure is a key factor in the stagnation of BTC’s price following ETF approvals.
- Other Random Sell Pressures:
- Besides Celsius and GBTC sell pressures, additional factors contribute to the challenges of the crypto market.
- Mt. Gox, after a decade-long wait, is providing the first reimbursements to creditors.
- Meanwhile, Bitcoin miners, facing falling prices, occasionally sell off their BTC reserves to cover mining costs.
- For instance, in late December, BTC miners sold off $130 million worth of BTC as prices declined.
These diverse sell pressures complicate the market dynamics, potentially causing short-term price declines. However, a long-term perspective remains, and the approach is to stay calm and “HODL on.”
Bitcoin

Despite Bitcoin experiencing a more than 10% drop in market value since the introduction of spot ETFs in the U.S. a week ago, crypto traders maintain a positive outlook for the broader market.
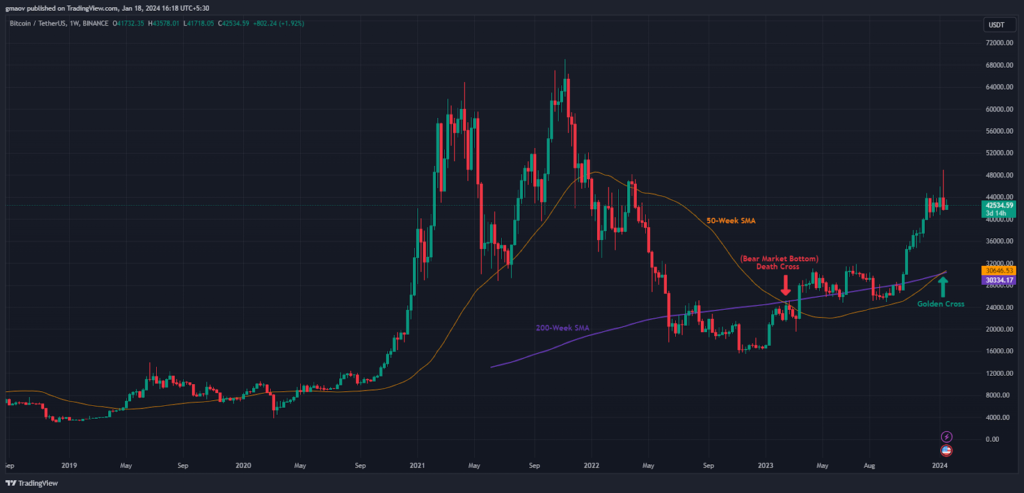
A notable development is the 50-week simple moving average (SMA) crossing above the 200-week SMA for the first time in recorded history, commonly referred to as a “golden cross.”
- This cross is seen by enthusiasts as a positive signal for asset prices, suggesting a shift towards a long-term bull market.
- However, some traders caution that crossovers, including the golden version, can be lagging indicators as they are based on historical data.
Nevertheless, the first golden cross on the weekly chart resulted from Bitcoin’s remarkable 70% rally to $42,700 in just four months.
Experienced traders recognize crossovers as potentially coinciding with trend exhaustion. For instance, the weekly death cross confirmed in early 2023 marked the bottom of the bear market.
- The daily chart’s golden and death crossovers for Bitcoin have shown a mixed record in predicting bullish and bearish trends.
- Despite these considerations, Bitcoin’s recent rally has slowed, trading 10% lower from the highs near $49,000 reached after the introduction of 11 spot ETFs in the U.S. last Thursday.
Observers attribute the diminishing bullish momentum to ETF flows not meeting the initially lofty market expectations. Bitcoin’s price action has been quieter this week, mostly settling in the $42,000-$43,000 range.
Ethereum

As Ethereum’s price surged on the charts last week, speculation abounded that investors might take profits as it reached the $2,500 level.
- Surprisingly, ETH’s price has not only touched but closed above $2,500 for the past three consecutive trading days, indicating that bulls are holding firm, anticipating further gains.

Beyond the price charts, the recent change in Ethereum exchange reserves reflects this bullish stance.
Cryptoquant’s exchange reserves data offers a real-time snapshot of the total units of Ethereum held in wallets on exchanges and trading platforms.
- On January 11, investors had 14.82 million ETH in exchange-hosted wallets.
- However, as of January 18, this figure has decreased to 14.69 million ETH.
Over the last seven days, investors have moved more than 130,000 ETH from exchange wallets into long-term storage, dispelling concerns of widespread profit-taking at the $2,500 milestone.

Source: CryptoQuant
A decline in exchange reserves is typically considered bullish for a crypto’s short-term price action, indicating a shift from trading wallets to long-term storage.
- This preference for long-term storage during a price rally signifies investor confidence and a commitment to holding for more gains.
- So, with the decrease in exchange supply over the past week, it’s unsurprising that Ethereum’s price has consolidated above the $2,500 support since January 15.
More…
Crucially, historical trends suggest that rapid declines in Ethereum exchange reserves often precede an uptrend in price. If this pattern repeats, Ethereum holders may anticipate a movement towards $2,600 in the coming days.
Meanwhile, The Blockchain Center’s Altcoin Season Index has surged to a peak of 78 out of 100, surpassing the crucial threshold of 75. This uptick indicates the initiation of the eagerly anticipated altcoin season.

Source: Blockchain Center
Typically, Altcoin season is a phase in which 75% of the top 50 altcoins outperform Bitcoin over 90 days. This phenomenon last occurred between late August and September 2022, resulting in substantial gains for several altcoins.
That wraps up this week’s Smart Money. Until next week!
Found value in the insights shared here? Check out our YouTube and Twitter, loaded with content meant to educate and entertain.
Follow our Telegram for a sneak peek at alpha; for an even deeper dive, join our Patreon community, where we share exclusive alpha for you to be the ‘early bird.’
Follow us today, and let’s explore Web3 together!


